 This number is
annualized in years that for various reasons were longer or shorter than 12 months, which
can happen because the fiscal year shifted, or because for some reason the data exactly at
the end of the fiscal year are unrepresentative.
This number is
annualized in years that for various reasons were longer or shorter than 12 months, which
can happen because the fiscal year shifted, or because for some reason the data exactly at
the end of the fiscal year are unrepresentative.
Some time in early 2004, I ran across a Web site maintained by the Department of the Treasury, listing the U.S. National Debt year by year since 1791. The numbers by themselves are too big to be meaningful, so I put them into a spreadsheet to see if I could extract any interesting trends and patterns over time.
When talking about a politically-charged issue like Federal budget deficits, it's hard to avoid being accused of shilling for one political faction or another, but I've tried to keep things rigorously objective, minimizing the judgment calls I needed to make lest my own political leanings bias the results. Over the years, I've gotten criticism from both left-wingers and right-wingers about this page, so I think I've been at least somewhat successful.
Assuming you mostly want to see the results, I'll get straight to them, but I recommend that you read the data sources, judgment calls and procedures I used to produce these tables.
These are the data from which all of the following tables are drawn, organized by year so you can draw your own conclusions about Presidents, Congresses, tax rates, etc.
The inflation-adjusted debt (seventh) column is simply the public debt expressed in 1983 dollars.
The deficit (eighth) column is the difference between one year's inflation-adjusted debt and the previous year's, displayed both as a number and as a bar-graph.
This number is
annualized in years that for various reasons were longer or shorter than 12 months, which
can happen because the fiscal year shifted, or because for some reason the data exactly at
the end of the fiscal year are unrepresentative.
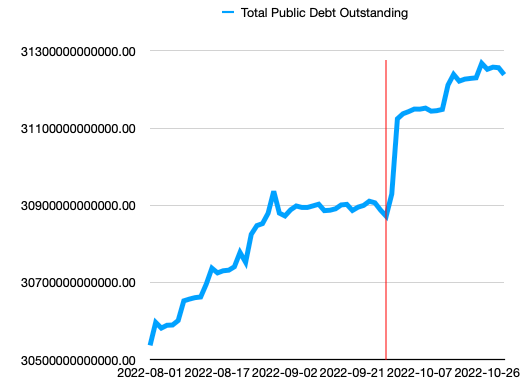
The most common reason for this is debt-ceiling standoffs: when the US reaches its legal debt limit, the Treasury takes "extraordinary measures" (shuffling money from one account to another) to keep the official public debt just below the limit while still paying the bills. This shows up as an artificial "flat line" in a graph of national debt, as in this example from 2022: as soon as the limit is raised (the red vertical line in this example), these "extraordinary measures" are unwound and the debt returns to roughly its previous trajectory. If the end of the fiscal year happens to fall in this "flat line" region, the official debt number on that date is misleading, so I use a date before or after the flat line and extrapolate linearly.
When there's a sudden unexpected economic event, I sometimes add an extra row to the tables to distinguish the effects of that event from what was happening already. For example, COVID-19 had no impact on the US economy until January or February 2020, and an enormous impact in March and April. So I have a row for fiscal 2019-2020 extrapolating from the first three months (October-December, as though COVID had never happened), and another row for the entire fiscal year from October through September as usual.
| Fiscal year | President's party | Senate majority party | House majority party | Top-bracket marginal income tax rate | National debt (millions) |
National debt (millions of 1983 dollars) |
Deficit (millions of 1983 dollars) |
Deficit in 1983 dollars ($=10 billion) | |||||
|---|---|---|---|---|---|---|---|---|---|---|---|---|---|
| 10/2024-9/2025 | D | R | D | R | R | 37% | $37,637,553 | $11,617,389 | $369,511 | $$$$$$$$$$$$$$$$$$$$$$$$$$$$$$$$$$$$$ | |||
| 10/2023-9/2024 | D | D | R | 37% | $35,464,674 | $11,247,879 | $445,102 | $$$$$$$$$$$$$$$$$$$$$$$$$$$$$$$$$$$$$$$$$$$$$ | |||||
| 10/2022-9/2023 | D | D | D | R | 37% | $33,167,334 | $10,802,777 | $382,266 | $$$$$$$$$$$$$$$$$$$$$$$$$$$$$$$$$$$$$$ | ||||
| 8/2021-9/2022 | D | D | D | 37% | $30,928,912 | $10,420,511 | $24,490 (annualized) | $$ | |||||
| 10/2020-7/2021 | R | D | R | D | D | 37% | $28,428,919 | $10,391,940 | $47,372 (annualized) | $$$$$ | |||
| 10/2019-9/2020 | R | R | D | 37% | $26,945,391 | $10,352,463 | $1,503,931 | $$$$$$$$$$$$$$$$$$$$$$$$$$$$$$$$$$$$$$$$$$$$$$$$$$$$$$$$$$$$$$$$$$$$$$$$$$$$$$$$$$$$$$$$$$$$$$$$$$$$$$$$$$$$$$$$$$$$$$$$$$$$$$$$$$$$$$$$$$$$$$$$$$$$$$ | |||||
| 10/2019-12/2019 | R | R | D | 37% | $23,201,380 | $9,028,688 | $720,624 (annualized) | $$$$$$$$$$$$$$$$$$$$$$$$$$$$$$$$$$$$$$$$$$$$$$$$$$$$$$$$$$$$$$$$$$$$$$$$ | |||||
| 10/2018-9/2019 | R | R | R | D | 37% | $22,719,402 | $8,848,532 | $325,262 | $$$$$$$$$$$$$$$$$$$$$$$$$$$$$$$$ | ||||
| 10/2017-9/2018 | R | R | R | 39.6 -> 37% | $21,516,058 | $8,533,175 | $278,854 | $$$$$$$$$$$$$$$$$$$$$$$$$$$$ | |||||
| 10/2016-9/2017 | D | R | R | R | 39.6% | $20,373,231 | $8,254,321 | $146,957 | $$$$$$$$$$$$$$$ | ||||
| 12/2015-9/2016 | D | R | R | 39.6% | $19,573,445 | $8,107,363 | $233,873 (annualized) | $$$$$$$$$$$$$$$$$$$$$$$ | |||||
| 10/2014-11/2015 | D | D | R | R | 39.6% | $18,827,323 | $7,900,151 | $363,718 (annualized) | $$$$$$$$$$$$$$$$$$$$$$$$$$$$$$$$$$$$ | ||||
| 11/2013-9/2014 | D | D | R | 39.6% | $17,824,071 | $7,488,130 | $155,132 (annualized) |
$$$$$$$$$$$$$$$$ | |||||
| 10/2012-10/2013 | D | D | R | 39.6% | $17,156,117 | $7,345,926 | $403,076 (annualized) | $$$$$$$$$$$$$$$$$$$$$$$$$$$$$$$$$$$$$$$$ | |||||
| 10/2011-9/2012 | D | D | R | 35% | $16,066,241 | $6,942,850 | $424,094 | $$$$$$$$$$$$$$$$$$$$$$$$$$$$$$$$$$$$$$$$$$ | |||||
| 10/2010-9/2011 | D | D | D | R | 35% | $14,790,340 | $6,518,756 | $310,330 | $$$$$$$$$$$$$$$$$$$$$$$$$$$$$$$ | ||||
| 10/2009-9/2010 | D | D | D | 35% | $13,561,623 | $6,208,425 | $693,824 | $$$$$$$$$$$$$$$$$$$$$$$$$$$$$$$$$$$$$$$$$$$$$$$$$$$$$$$$$$$$$$$$$$$$$ | |||||
| 10/2008-9/2009 | R | D | D | D | 35% | $11,909,829 | $5,514,601 | $932,561 | $$$$$$$$$$$$$$$$$$$$$$$$$$$$$$$$$$$$$$$$$$$$$$$$$$$$$$$$$$$$$$$$$$$$$$$$$$$$$$$$$$$$$$$$$$$$$ | ||||
| 10/2007-9/2008 | R | D | D | 35% | $10,024,724 | $4,582,040 | $261,615 | $$$$$$$$$$$$$$$$$$$$$$$$$$ | |||||
| 10/2006-9/2007 | R | R | D | R | D | 35% | $9,007,653 | $4,320,424 | $127,731 | $$$$$$$$$$$$$ | |||
| 10/2005-9/2006 | R | R | R | 35% | $8,506,973 | $4,192,692 | $202,396 | $$$$$$$$$$$$$$$$$$$$ | |||||
| 10/2004-9/2005 | R | R | R | 35% | $7,932,709 | $3,990,296 | $104,539 | $$$$$$$$$$ | |||||
| 10/2003-9/2004 | R | R | R | 35% | $7,379,052 | $3,885,757 | $223,105 | $$$$$$$$$$$$$$$$$$$$$$ | |||||
| 10/2002-9/2003 | R | D | R | R | 38.6% | $6,783,231 | $3,662,652 | $221,637 | $$$$$$$$$$$$$$$$$$$$$$ | ||||
| 10/2001-9/2002 | R | D | R | 39.1% | $6,228,235 | $3,441,014 | $183,884 | $$$$$$$$$$$$$$$$$$ | |||||
| 10/2000-9/2001 | D | R | R | D | R | 39.6% | $5,807,463 | $3,257,130 | -$9,523 | $ | |||
| 10/1999-9/2000 | D | R | R | 39.6% | $5,674,178 | $3,266,654 | -$102,179 | $$$$$$$$$$ | |||||
| 10/1998-9/1999 | D | R | R | 39.6% | $5,656,270 | $3,368,833 | -$9,035 | $ | |||||
| 10/1997-9/1998 | D | R | R | 39.6% | $5,526,193 | $3,377,869 | $19,838 | $$ | |||||
| 10/1996-9/1997 | D | R | R | 39.6% | $5,413,146 | $3,358,031 | $46,997 | $$$$$ | |||||
| 10/1995-9/1996 | D | R | R | 39.6% | $5,224,810 | $3,311,034 | $64,308 | $$$$$$ | |||||
| 10/1994-9/1995 | D | D | R | D | R | 39.6% | $4,973,982 | $3,246,725 | $105,661 | $$$$$$$$$$$ | |||
| 10/1993-9/1994 | D | D | D | 39.6% | $4,692,749 | $3,141,064 | $100,755 | $$$$$$$$$$ | |||||
| 10/1992-9/1993 | R | D | D | D | 31% | $4,411,488 | $3,040,309 | $163,720 | $$$$$$$$$$$$$$$$ | ||||
| 10/1991-9/1992 | R | D | D | 31% | $4,064,620 | $2,876,589 | $205,085 | $$$$$$$$$$$$$$$$$$$$$ | |||||
| 10/1990-9/1991 | R | D | D | 28% | $3,665,303 | $2,671,504 | $234,945 | $$$$$$$$$$$$$$$$$$$$$$$ | |||||
| 10/1989-9/1990 | R | D | D | 28% | $3,233,313 | $2,436,559 | $150,614 | $$$$$$$$$$$$$$$ | |||||
| 10/1988-9/1989 | R | D | D | 28% | $2,857,430 | $2,285,945 | $113,710 | $$$$$$$$$$$ | |||||
| 10/1987-9/1988 | R | D | D | 38.5% | $2,602,337 | $2,172,235 | $128,516 | $$$$$$$$$$$$$ | |||||
| 10/1986-9/1987 | R | R | D | D | 50% | $2,350,276 | $2,043,719 | $115,132 | $$$$$$$$$$$$ | ||||
| 10/1985-9/1986 | R | R | D | 50% | $2,125,302 | $1,928,587 | $245,204 | $$$$$$$$$$$$$$$$$$$$$$$$$ | |||||
| 10/1984-9/1985 | R | R | D | 50% | $1,823,103 | $1,683,382 | $185,986 | $$$$$$$$$$$$$$$$$$$ | |||||
| 10/1983-9/1984 | R | R | D | 50% | $1,572,266 | $1,497,396 | $129,760 | $$$$$$$$$$$$$ | |||||
| 10/1982-9/1983 | R | R | D | 50% | $1,377,210 | $1,367,637 | $201,105 | $$$$$$$$$$$$$$$$$$$$ | |||||
| 10/1981-9/1982 | R | R | D | 70% | $1,142,034 | $1,166,531 | $95,871 | $$$$$$$$$$ | |||||
| 10/1980-9/1981 | D | R | D | R | D | 70% | $997,855 | $1,070,660 | -$9,937 | $ | |||
| 10/1979-9/1980 | D | D | D | 70% | $907,701 | $1,080,596 | -$27,338 | $$$ | |||||
| 10/1978-9/1979 | D | D | D | 70% | $826,519 | $1,107,934 | -$52,282 | $$$$$ | |||||
| 10/1977-9/1978 | D | D | D | 70% | $771,544 | $1,160,217 | $22,041 | $$ | |||||
| 7/1976-9/1977 | R | D | D | D | 70% | $698,840 | $1,138,176 | $36,691 (annualized) | $$$$ | ||||
| 7/1975-6/1976 | R | D | D | 70% | $620,433 | $1,092,312 | $97,556 | $$$$$$$$$$ | |||||
| 7/1974-6/1975 | R | D | D | 70% | $533,189 | $994,756 | $25,246 | $$$ | |||||
| 7/1973-6/1974 | R | D | D | 70% | $475,059 | $969,510 | -$67,010 | $$$$$$$ | |||||
| 7/1972-6/1973 | R | D | D | 70% | $458,141 | $1,036,519 | $11,914 | $ | |||||
| 7/1971-6/1972 | R | D | D | 70% | $427,260 | $1,024,605 | $43,990 | $$$$ | |||||
| 7/1970-6/1971 | R | D | D | 70% | $398,129 | $980,615 | $24,639 | $$ | |||||
| 7/1969-6/1970 | R | D | D | 70% | $370,918 | $955,976 | -$10,473 | $ | |||||
| 7/1968-6/1969 | D | R | D | D | 70% | $353,720 | $966,449 | -$35,218 | $$$$ | ||||
| 7/1967-6/1968 | D | D | D | 70% | $347,578 | $1,001,667 | $22,024 | $$ | |||||
| 7/1966-6/1967 | D | D | D | 70% | $326,220 | $979,642 | -$7,725 | $ | |||||
| 7/1965-6/1966 | D | D | D | 70% | $319,907 | $987,368 | -$16,664 | $$ | |||||
| 7/1964-6/1965 | D | D | D | 77% | $317,273 | $1,004,031 | -$1,494 | ||||||
| 7/1963-6/1964 | D | D | D | 91% | $311,712 | $1,005,525 | $5,984 | $ | |||||
| 7/1962-6/1963 | D | D | D | 91% | $305,859 | $999,541 | $12,121 | $ | |||||
| 7/1961-6/1962 | D | D | D | 91% | $298,200 | $987,420 | $17,719 | $$ | |||||
| 7/1960-6/1961 | R | D | D | D | 91% | $288,970 | $969,701 | $2,367 | |||||
| 7/1959-6/1960 | R | D | D | 91% | $286,330 | $967,334 | -$11,037 | $ | |||||
| 7/1958-6/1959 | R | D | D | 91% | $284,705 | $978,371 | $22,166 | $$ | |||||
| 7/1957-6/1958 | R | D | D | 91% | $276,343 | $956,205 | -$6,525 | $ | |||||
| 7/1956-6/1957 | R | D | D | 91% | $270,527 | $962,730 | -$40,030 | $$$$ | |||||
| 7/1955-6/1956 | R | D | D | 91% | $272,751 | $1,002,760 | -$24,858 | $$ | |||||
| 7/1954-6/1955 | R | R | D | R | D | 91% | $274,374 | $1,027,619 | $19,219 | $$ | |||
| 7/1953-6/1954 | R | R | R | 92% | $271,259 | $1,008,400 | $15,598 | $$ | |||||
| 7/1952-6/1953 | D | R | D | R | D | R | 92% | $266,071 | $992,802 | $15,047 | $$ | ||
| 7/1951-6/1952 | D | D | D | 91% | $259,105 | $977,7553 | -$7,658 | $ | |||||
| 7/1950-6/1951 | D | D | D | 91% | $255,221 | $985,413 | -$95,920 | $$$$$$$$$$ | |||||
| 7/1949-6/1950 | D | D | D | 91% | $257,357 | $1,081,333 | $23,717 | $$ | |||||
| 7/1948-6/1949 | D | R | D | R | D | 91% | $252,770 | $1,057,617 | $10,761 | $ | |||
| 7/1947-6/1948 | D | R | R | 91% | $252,292 | $1,046,856 | -$127,173 | $$$$$$$$$$$$ | |||||
| 7/1946-6/1947 | D | D | R | D | R | 91% | $258,286 | $1,174,029 | -$266,731 | $$$$$$$$$$$$$$$$$$$$$$$$$$$ | |||
| 7/1945-6/1946 | D | D | D | 94% | $269,422 | $1,440,760 | $11,577 | $ | |||||
| 7/1944-6/1945 | D | D | D | 94% | $258,682 | $1,429,183 | $287,119 | $$$$$$$$$$$$$$$$$$$$$$$$$$$$$ | |||||
| 7/1943-6/1944 | D | D | D | 88% | $201,003 | $1,142,065 | $360,944 | $$$$$$$$$$$$$$$$$$$$$$$$$$$$$$$$$$$$ | |||||
| 7/1942-6/1943 | D | D | D | 88% | $136,696 | $781,121 | $336,811 | $$$$$$$$$$$$$$$$$$$$$$$$$$$$$$$$$$ | |||||
| 7/1941-6/1942 | D | D | D | 81% | $72,422 | $444,309 | $111,238 | $$$$$$$$$$$ | |||||
| 7/1940-6/1941 | D | D | D | 79% | $48,961 | $333,071 | $28,337 | $$$ | |||||
| 7/1939-6/1940 | D | D | D | 79% | $42,967 | $304,734 | $11,694 | $ | |||||
| 7/1938-6/1939 | D | D | D | 79% | $40,439 | $293,040 | $29,460 | $$$ | |||||
| 7/1937-6/1938 | D | D | D | 79% | $37,164 | $263,579 | $10,631 | $ | |||||
| 7/1936-6/1937 | D | D | D | 79% | $36,424 | $252,949 | $8,177 | $ | |||||
| 7/1935-6/1936 | D | D | D | 63% | $33,779 | $244,772 | $35,276 | $$$$ | |||||
| 7/1934-6/1935 | D | D | D | 63% | $28,700 | $209,496 | $7,606 | $ | |||||
| 7/1933-6/1934 | D | D | D | 63% | $27,053 | $201,889 | $24,419 | $$ | |||||
| 7/1932-6/1933 | R | D | R | D | D | 63% | $22,539 | $177,470 | $34,183 | $$$ | |||
| 7/1931-6/1932 | R | R | D | 25% | $19,487 | $143,287 | $32,020 | $$$ | |||||
| 7/1930-6/1931 | R | R | R | D | 25% | $16,801 | $111,267 | $14,926 | $ | ||||
| 7/1929-6/1930 | R | R | R | 25% | $16,185 | $96,341 | -$2,671 | ||||||
| 7/1928-6/1929 | R | R | R | 25% | $16,931 | $99,012 | -$3,937 | ||||||
| 7/1927-6/1928 | R | R | R | 25% | $17,604 | $102,949 | -$2,232 | ||||||
| 7/1926-6/1927 | R | R | R | 25% | $18,511 | $105,181 | -$5,797 | $ | |||||
| 7/1925-6/1926 | R | R | R | 25% | $19,643 | $110,979 | -$6,257 | $ | |||||
| 7/1924-6/1925 | R | R | R | 46% | $20,516 | $117,235 | -$7,769 | $ | |||||
| 7/1923-6/1924 | R | R | R | 58% | $21,251 | $125,005 | -$6,464 | $ | |||||
| 7/1922-6/1923 | R | R | R | 58% | $22,349 | $131,469 | -$6,036 | $ | |||||
| 7/1921-6/1922 | R | R | R | 73% | $22,963 | $137,505 | $1,270 | ||||||
| 7/1920-6/1921 | D | R | R | R | 73% | $23,977 | $136,236 | $12,061 | $ | ||||
| 7/1919-6/1920 | D | R | R | 73% | $25,952 | $124,174 | -$37,902 | $$$$ | |||||
| 7/1918-6/1919 | D | D | R | D | R | 77% | $27,391 | $162,077 | $62,810 | $$$$$$ | |||
| 7/1917-6/1918 | D | D | D | 67% | $14,592 | $99,266 | $55,284 | $$$$$$ | |||||
| 7/1916-6/1917 | D | D | D | 15% | $5,718 | $43,983 | $10,564 | $ | |||||
| 7/1915-6/1916 | D | D | D | 7% | $3,609 | $33,418 | $3,140 | ||||||
| 7/1914-6/1915 | D | D | D | 7% | $3,058 | $30,279 | $859 | ||||||
| 7/1913-6/1914 | D | D | D | 7% | $2,912 | $29,419 | -$338 | ||||||
| 7/1912-6/1913 | R | D | D | D | no data | $2,916 | $29,757 | $488 (estimated) | |||||
| 7/1911-6/1912 | R | D | D | no data | $2,868 | $29,269 (estimated) |
no data | ||||||
| 7/1910-6/1911 | R | D | D | no data | $2,765 | no data | no data | ||||||
The largest one-year deficit in history was in fiscal 2019-2020, when the COVID-19 pandemic dramatically cut tax revenues while Congress enacted expensive bailouts to keep the economy from collapsing while many workers were unable to go to work. Second to that was fiscal 2008-2009, in the trough of the recession and the peak of TARP and stimulus spending intended to end that recession.
The following graph shows the "real" (inflation-adjusted) national debt over the past century. This measures "how much consumer goods would it take to pay off the debt?" A “sustainable” budget is one in which it doesn't get harder to pay off the debt -- in other words, inflation-adjusted deficits and surpluses balance one another over a number of years. Sometimes (e.g. 1998-2001 and 1978-1981), the national debt grows in nominal dollars, but actually becomes easier to pay off because inflation has made those dollars "smaller". I've put the graph on a log scale, so (for example) a 10% growth in 1941 would look the same as a 10% growth in 1915. (The vertical scale is labelled in 1983 dollars; if we used a different base year, the graph would look exactly the same except for the numbers on the vertical scale.)
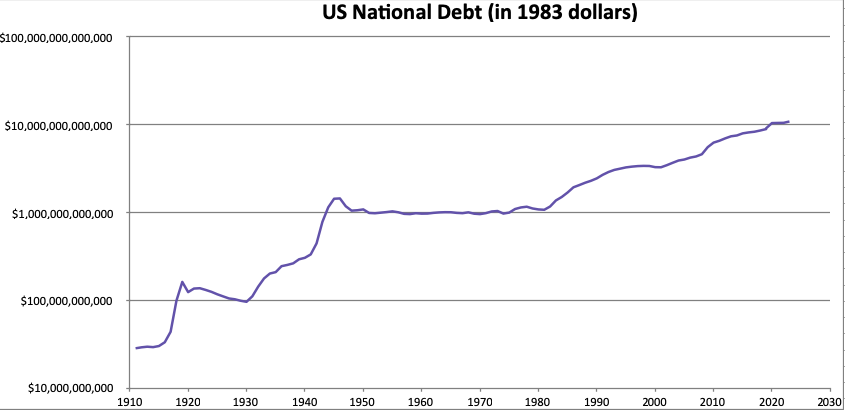
Note the spikes for World Wars I and II, the upward slope for the Great Depression, and the remarkable flat line from 1946 to 1981, during which time real national debt varied by less than 25%. In other words, the Federal government had a “sustainable” debt for 35 years, as years of slight surplus almost exactly balanced years of slight deficit. But from 1981-2020, the real debt has grown by a factor of over ten, shrinking in only four of those years.
Most recently, there's a curve upwards from 2016-2020, presumably due to the Trump tax cuts, the COVID-19 recession and measures to fight COVID, followed by two years of relatively small deficits in 2020-2022 as inflation cancelled the nominal growth in the national debt. Since inflation has eased, it's no longer cancelling out that nominal growth, and 2022-2023 had a deficit slightly larger than 2018-2019, before COVID.
I then grouped the data by Presidential administration. As mentioned above, I consider the fiscal year spanning a Presidential election and inauguration to be part of the outgoing administration. This is usually a fair assumption, because most government programs take a while to start, and last for multiple years.
Fiscal 2008-2009 is perhaps an exception: both the outgoing and incoming Presidents signed expensive economic-stimulus programs designed to take effect immediately. Accordingly, in the following tables, I've given George W. Bush two rows in the table: one for his whole term, consistent with all other Presidents, and one counting only his first seven years, ending with the figures of September 2008, by which time a recession had started but the government measures to deal with it hadn't been enacted yet.
After deciding on those conventions, there were still several different reasonable ways to look at the data.
Again, all of these numbers are in inflation-adjusted (1983) dollars. I don't include "partial" years of 6 months or less.
I subtract the deficit in a President's first year from the deficit in the year after that President stepped down (or, in the case of the current President, from the most recent deficit figures I have). This change in deficit is then divided by the number of years it took to achieve it.
| President | political party | change in deficit (millions) | years in office | avg. change in deficit | avg. change in deficit ($ = 5billion) | |
|---|---|---|---|---|---|---|
| J.R.Biden | Democrat | $322,139 | 4 | $80,535 | $$$$$$$$$$$$$$$$$ | |
| D.J.Trump | Republican | -$99,585 | 3.833 | -$25,979 | $$$$$ | |
| D.J.Trump 10/2017-12/2019 |
Republican | +$573,667 | 2.25 | +$254,963 | $$$$$$$$$$$$$$$$$$$$$$$$$$$$$$$$$$$$$$$$$$$$$$$$$$$ | |
| B.H.Obama | Democrat | -$785,604 | 8 | -$98,200 | $$$$$$$$$$$$$$$$$$$$ | |
| G.W.Bush | Republican | +$942,085 | 8 | +$117,761 | $$$$$$$$$$$$$$$$$$$$$$$$ | |
| G.W.Bush first 7 years |
Republican | +$271,139 | 7 | +$38,734 | $$$$$$$$ | |
| W.J.Clinton | Democrat | -$173,244 | 8 | -$21,655 | $$$$ | |
| G.H.W.Bush | Republican | +$50,010 | 4 | +$12,503 | $$$ | |
| R.Reagan | Republican | +$123,646 | 8 | +$15,456 | $$$ | |
| J.Carter | Democrat | -$46,628 | 4 | -$11,657 | $$ | |
| G.Ford (Note change of fiscal year) |
Republican | +$103,701 | 3.25 | +$31,908 | $$$$$$ | |
| R.M.Nixon | Republican | $60,464 | 6 | $10,077 | $$ | |
| L.B.Johnson | Democrat | -$41,202 | 5 | -$8,240 | $$ | |
| J.F.Kennedy | Democrat | +$3,617 | 3 | +$1,206 | ||
| D.D.Eisenhower | Republican | -$12,680 | 8 | -$1,585 | ||
| H.S.Truman | Democrat | -$272,072 | 8 | -$34,009 | $$$$$ | |
| F.D.Roosevelt | Democrat | +$252,936 | 12 | +$21,078 | $$$$ | |
| H.Hoover | Republican | +$38,120 | 4 | +$9,530 | $$ | |
| C.Coolidge | Republican | +$2,100 | 6 | +$351 | ||
| W.G.Harding | Republican | -$18,097 | 2 | -$9,049 | $$ | |
| W.Wilson | Democrat | +$11,573 | 8 | +$1,447 | ||
| W.H.Taft | Republican | insufficient data | 4 | insufficient data | ||
Note that the "avg. change in deficit" numbers are a change in national debt divided by the square of the length of the administration; they're inverse-quadratic in time, and therefore susceptible to short-term noise.
That said, the first 2.25 years of the Trump administration (before COVID-19) showed over six times as much annual deficit growth as the G.W. Bush administration (before the 2008 financial crisis). The following nine months doubled the deficit again, while the year after that erased it through inflation.
Obviously, many of the reasons a deficit grows or shrinks are beyond the President's control: Congress, the economy, the beginning or ending of a war, the beginning or ending of a recession, etc. For example, the beginning of World War II can be blamed for much of FDR's increase in the deficit, just as the end of World War II and the start of the post-war economic boom can be credited for much of Truman's matching decrease. I'm not sure what happened to Ford: he faced an economic recession, but so have many Presidents.
In my lifetime, every Democratic President has left office with a smaller deficit than he inherited, while every Republican President except Trump has left office with a larger deficit than he inherited. Of course, these are annual figures; Trump had a surge of inflation in his last fiscal year that sharply reduced the deficit in that year.
If we want to reduce the noise of year-to-year variations (due to wars, recessions, inflation, etc.), we can look at the total debt accumulated over the course of a Presidential administration, and average it by year.
The previous approach, looking only at starting and ending deficits, doesn't distinguish between a President who oversees initially increasing deficits, then decreasing at the end (like Reagan, Clinton, or Trump) and a President who oversees initially decreasing deficits, then increasing at the end (like Carter or Hoover), even though the former racks up more debt. So I computed the average annual deficit over a President's term(s).
| President | political party | total accumulated debt (millions) | years in office | average annual deficit (millions) | avg. deficit ($ = 10billion) | |
|---|---|---|---|---|---|---|
| J.R.Biden | Democrat | $1,225,449 | 4 | $306,362 | $$$$$$$$$$$$$$$$$$$$$$$$$$$$$$$ | |
| D.J.Trump | Republican | $2,137,619 | 3.833 | $523,499 | $$$$$$$$$$$$$$$$$$$$$$$$$$$$$$$$$$$$$$$$$$$$$$$$$$$$ | |
| D.J.Trump 10/2017-12/2019 |
Republican | $774,367 | 2.25 | $344,163 | $$$$$$$$$$$$$$$$$$$$$$$$$$$$$$$$$$ | |
| B.H.Obama | Democrat | $2,739,719 | 8 | $342,465 | $$$$$$$$$$$$$$$$$$$$$$$$$$$$$$$$$$ | |
| G.W.Bush | Republican | $2,257,471 | 8 | $282,184 | $$$$$$$$$$$$$$$$$$$$$$$$$$$$ | |
| G.W.Bush first 7 years |
Republican | $1,324,910 | 7 | $189,273 | $$$$$$$$$$$$$$$$$$$ | |
| W.J.Clinton | Democrat | $216,821 | 8 | $27,103 | $$$ | |
| G.H.W.Bush | Republican | $754,365 | 4 | $188,591 | $$$$$$$$$$$$$$$$$$$ | |
| R.Reagan | Republican | $1,215,285 | 8 | $151,911 | $$$$$$$$$$$$$$$ | |
| J.Carter | Democrat | -$67,516 | 4 | -$16,879 | $$ | |
| G.Ford (Note change in fiscal year) |
Republican | $168,666 | 3.25 | $51,897 | $$$$$ | |
| R.M.Nixon | Republican | $28,307 | 6 | $4718 | ||
| L.B.Johnson | Democrat | -$39,077 | 5 | -$7,815 | $ | |
| J.F.Kennedy | Democrat | $35,824 | 3 | $11,941 | $ | |
| D.D.Eisenhower | Republican | -$23,101 | 8 | -$2,888 | ||
| H.S.Truman | Democrat | -$436,381 | 8 | -$54,548 | $$$$$ | |
| F.D.Roosevelt | Democrat | $1,251,713 | 12 | $104,309 | $$$$$$$$$$ | |
| H.Hoover | Republican | $78,458 | 4 | $19,614 | $$ | |
| C.Coolidge | Republican | -$32,457 | 6 | -$5,409 | $ | |
| W.G.Harding | Republican | -$4,767 | 2 | -$2,383 | ||
| W.Wilson | Democrat | $106,478 | 8 | $13,310 | $ | |
| W.H.Taft | Republican | insufficient data | 4 | insufficient data | ||
Again, Republican Presidents seem to rack up the big debts, at least in my lifetime (which started in 1964). Democratic Presidents (except Obama) tend to be "troughs" in the above graph, relative to their Republican successors and predecessors. Before 1964, the pattern is reversed: three of the four Democratic Presidents ran deficits over their time in office, while three of the four Republican Presidents ran surpluses.
The 3.833-year Trump administration (truncated for data-analysis purposes because of a debt-ceiling standoff) accrued slightly less debt than the 8-year G.W. Bush administration. The eight years of the Obama administration accrued 23% more total debt than the eight years of the G.W. Bush administration, which in turn was almost twice as much as eight years of Reagan or twelve years of FDR.
The biggest accrued-debt-per-year figures are associated (in descending order) with D.J. Trump, B.H. Obama, J.R. Biden, G.W. Bush, G.H.W. Bush, Ronald Reagan, FDR, Gerald Ford, Bill Clinton, and Herbert Hoover.
Since many of the items in the budget are multi-year commitments with considerable inertia (most obviously, interest on the national debt!), I recomputed the previous numbers, subtracting the annual deficit in each President's first year. In other words, this table compares how much debt was actually accumulated with how much would have been accumulated if deficits had continued as they were when the President took office.
| President | political party | average deficit (from prev. table) |
deficit in first year | relative average deficit | relative avg. deficit ($ = 10billion) | |
|---|---|---|---|---|---|---|
| J.R.Biden | Democrat | $306,362 | $47,372 | $258,990 | $$$$$$$$$$$$$$$$$$$$$$$$$$ | |
| D.J.Trump | Republican | $523,499 | $146,957 | $376,541 | $$$$$$$$$$$$$$$$$$$$$$$$$$$$$$$$$$$$$$ | |
| D.J.Trump 10/2017-12/2019 |
Republican | $344,163 | $146,957 | $197,206 | $$$$$$$$$$$$$$$$$$$$ | |
| B.H.Obama | Democrat | $342,461 | $932,561 | -$590,100 | $$$$$$$$$$$$$$$$$$$$$$$$$$$$$$$$$$$$$$$$$$$$$$$$$$$$$$$$$$$ | |
| G.W.Bush | Republican | $282,184 | -$9,524 | $291,708 | $$$$$$$$$$$$$$$$$$$$$$$$$$$$$ | |
| G.W.Bush first 7 years |
Republican | $189,273 | -$9,524 | $198,797 | $$$$$$$$$$$$$$$$$$$$ | |
| W.J.Clinton | Democrat | $27,103 | $163,720 | -$136,617 | $$$$$$$$$$$$$$ | |
| G.H.W.Bush | Republican | $188,591 | $113,710 | $74,882 | $$$$$$$ | |
| R.Reagan | Republican | $151,911 | -$9,937 | $161,847 | $$$$$$$$$$$$$$$$ | |
| J.Carter | Democrat | -$16,879 | $36,691 | -$53,570 | $$$$$ | |
| G.Ford | Republican | $51,897 | -67,010 | $118,907 | $$$$$$$$$$$$ | |
| R.M.Nixon | Republican | $4718 | -$35,218 | $39,936 | $$$$ | |
| L.B.Johnson | Democrat | -$7,815 | $5,984 | -$13,800 | $ | |
| J.F.Kennedy | Democrat | $11,941 | $2,367 | $9,574 | $ | |
| D.D.Eisenhower | Republican | -$2,888 | $15,047 | -$17,935 | $$ | |
| H.S.Truman | Democrat | -$54,548 | $287,119 | -$341,666 | $$$$$$$$$$$$$$$$$$$$$$$$$$$$$$$$$$ | |
| F.D.Roosevelt | Democrat | $104,309 | $34,183 | $70,126 | $$$$$$$ | |
| H.Hoover | Republican | $9,614 | -$3,936 | $23,551 | $$ | |
| C.Coolidge | Republican | -$5,409 | -$6,036 | $627 | ||
| W.G.Harding | Republican | -$2,383 | $12,061 | -$14,444 | $ | |
| W.Wilson | Democrat | $13,310 | $488 | $12,822 | $ | |
| W.H.Taft | Republican | insufficient data | insufficient data | insufficient data | ||
Again, Truman is an outlier: he took office in the middle of World War II, which immediately followed the Great Depression. The Federal government was running an enormous annual deficit in his first year, so it would have been remarkable if it hadn't decreased during his term. Likewise, Obama took office in the middle of, by far, the biggest-deficit year in history, dealing with two wars and the most severe recession since the 1930's; it would have been remarkable if the deficit hadn't decreased during his term.
Presidents Trump and G.W. Bush both took office in booming economies and faced major economic crises near the ends of their Presidencies; I've given each of them two rows in the table to isolate the effect of that late-term crisis. In this table, the pre-crisis figures for the Trump administration are almost exactly the same as the pre-crisis figures for the G.W. Bush administration. The reasons are presumably different, since the G.W. Bush administration faced the 9/11 attacks and a recession in its first year, while the Trump administration faced no major crises until 2020.
In the 111 years for which this Web page has adequate data, there have been nine Democratic and ten Republican Presidents. Five of the nine Democrats oversaw average deficits smaller than they inherited, while eight of the ten Republicans oversaw average deficits larger than they inherited.
Last modified: Sun Oct 6 19:52:09 EDT 2024
Stephen Bloch / sbloch1964@gmail.com