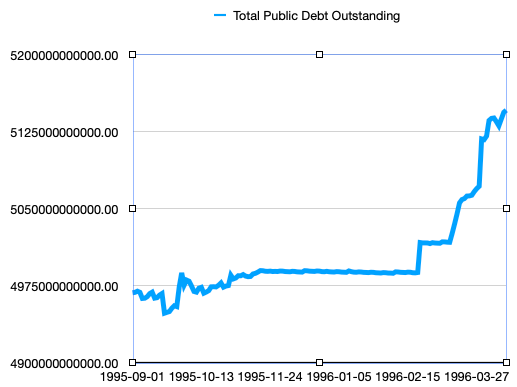
Before 1917, every issue of US government bonds was authorized by a separate Act of Congress. In 1917, Congress authorized the Treasury Department to issue bonds whenever it wished, up to a specified total, which was raised many times in the 20th century. In 1974, Congress gained much more power over Federal budgets, and Representative Dick Gephardt proposed a rule saying that when Congress appropriates funds for a budget, it has implicitly authorized whatever debt is necessary to carry out that budget. Under the leadership of House Speaker Newt Gingrich, this rule was repealed in 1995, and the House refused to raise the debt limit unless President Clinton agreed to the spending cuts in its budget bill. Large parts of the Federal government shut down for 5 days, and then again for 21 days.
But this Web page isn't about government shutdowns; it's about national debt numbers. During the 1995 standoff, the Department of the Treasury, on reaching the statutory debt limit, was caught between three contradictory laws: already-passed budget resolutions required it to spend a certain amount of money, which was greater than tax revenues, so the laws of arithmetic required it to take on debt, and the debt- limit law forbade it to take on any more debt. The Treasury responded with "extraordinary measures" (i.e. accounting tricks, shuffling money from one account to another) to keep the official national debt below the limit; this shows up as an artificial flat-line in the graph, followed (once an agreement was reached and the "extraordinary measures" unwound) by a return to the pre-crisis trajectory. Any spending cuts included in the agreement wouldn't visibly affect the national debt for at least several months.
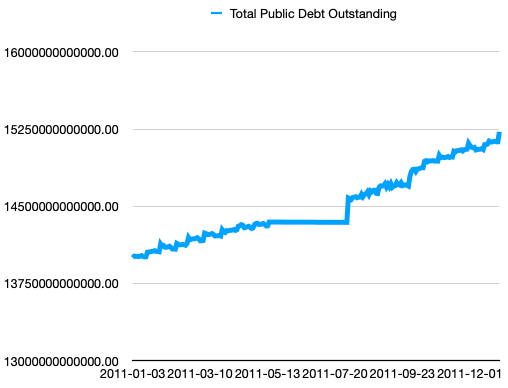
Much the same happened in 2011:
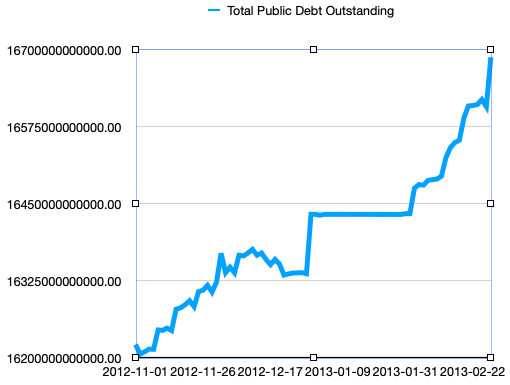
And in early 2013:
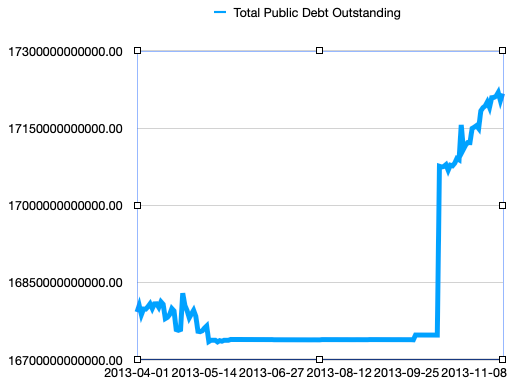
And later in 2013:
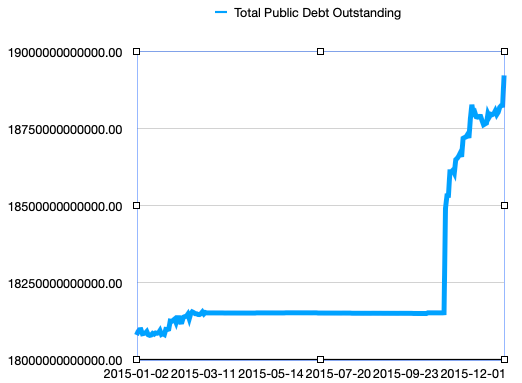
And in in 2014-2015: from the end of February, 2015 to the end of October, the national debt varied by less than $5 billion, then jumped by $340 billion on Nov. 2, the day Congress increased the debt limit, and by the end of November it had grown by another $335 billion.
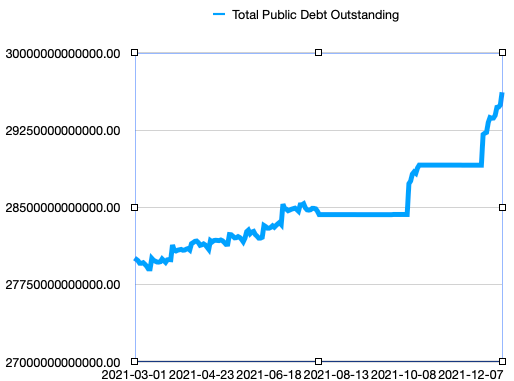
The same thing happened again in 2021: from August 1 to October 14, and again from October 25 to December 15.
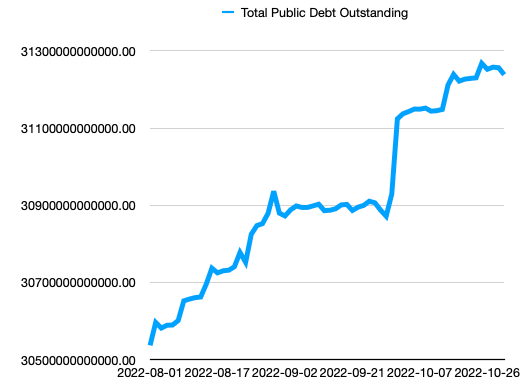
And again in 2022, from from mid-August to the beginning of October:
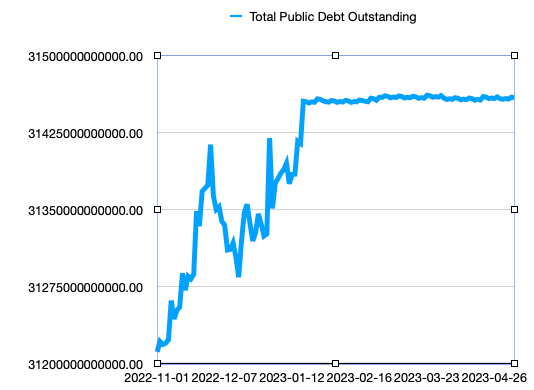
And again in 2023: the debt ceiling was reached in mid-January, and as I write this in May, it hasn't been raised yet.
In many of these cases, the end of the fiscal year fell in the middle of a flat-line, so using the official debt on that day would produce an artificially low number. So I interpolate linearly from the debt either just before the start of "extraordinary measures" or just after they ended, whichever is closer to September 30. As a result, I treat 2012-2013 as 13 months long, 2013-2014 as 11 months long, 2014-2015 as 14 months long, 2015-2016 as 10 months long, 2020-2021 as 10 months long, 2021-2022 as 11 months long. And my usual practice of adding an entry to the tables halfway through the fiscal year (March 30) is difficult in 2023 because I only have three months' worth of realistic data, followed by four months of artificially imposed flat-line.
This is a partisan tactic. All of the debt-ceiling crises listed above occurred when a Republican-led House of Representatives faced a Democratic President. As far as I can tell, no Democratic House has ever refused to raise the debt limit, nor has a Republican House ever refused to raise the debt limit when the President was a Republican.